Free recipe & menu costing spreadsheet
Work out a true plate cost in the calculator below, or take the spreadsheet. Both handle pack sizes and yield — the part that trips everyone up.
Most free food-cost templates ask you for a cost per gram. But you don’t buy grams — you buy a 25 kg sack of flour, a 5 litre drum of oil, a whole side of salmon. Converting all that by hand is where the errors creep in, and it’s why so many costing sheets quietly understate the dishes that matter most.
Download the costing spreadsheet
.xlsx — Excel, Google Sheets, Numbers, LibreOffice
⬇ Download free — no emailPlate cost calculator
Enter what you buy and how much you use. Yield is applied automatically. Nothing is uploaded.
The thing almost every free template gets wrong
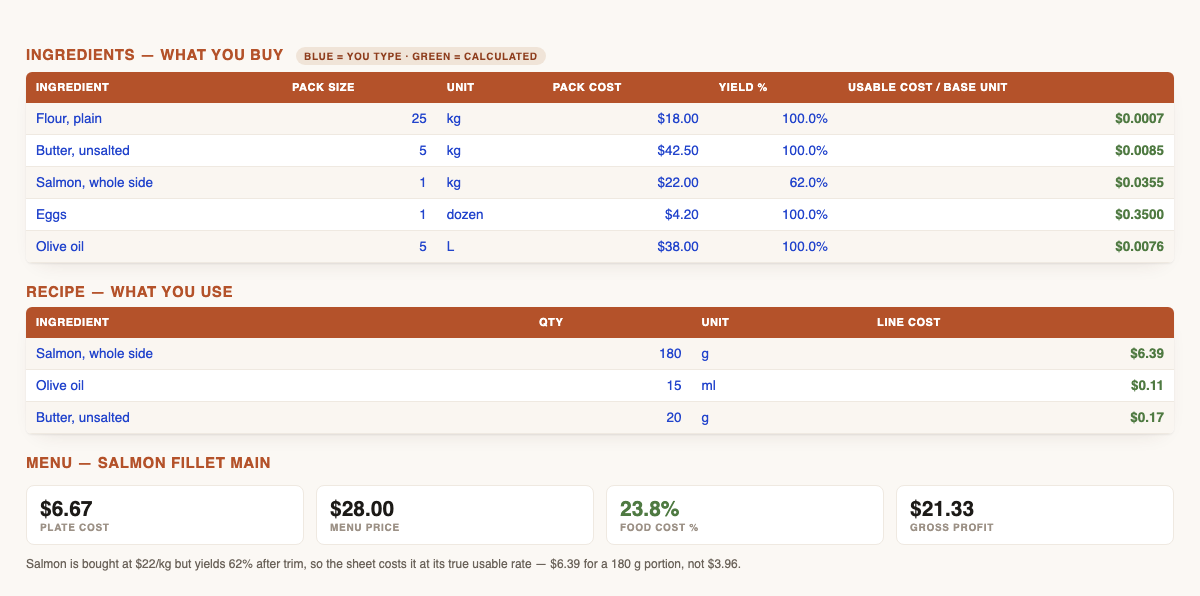
Yield. You buy a side of salmon at $22/kg. After skin, pin bones and trim, about 62% reaches the plate. So every usable gram costs you 1.6× the sticker price — $0.0355/g, not $0.022/g.
On a 180 g portion that’s the difference between costing it at $3.96 and the truth, $6.39. Do that across a menu and you can run a “30% food cost” that is really 40%, and never understand why the margin isn’t there at the end of the month.
This sheet asks for yield on every ingredient and applies it automatically. Set flour to 100% and salmon to 62%, and every recipe using them reprices itself correctly. Change a pack price once and the whole menu updates.
What it does
- Ingredients — enter the pack size, pack cost and yield you actually buy. It derives the true usable cost per gram, millilitre or unit.
- Unit conversion built in — kg, g, lb, oz, L, ml, fl oz, gallon, each, dozen. Buy in sacks, cook in grams.
- Recipes — one line per ingredient, costed instantly against the true usable cost.
- Menu — recipe cost, cost per portion, food cost % and gross profit per dish.
- Set your own target food cost %. Any dish over it turns red; anything at or under turns green.
- 60 ingredients, 80 recipe lines, 30 menu items — enough for a real menu.
A worked example, from the file itself
| Line | Qty | True cost |
|---|---|---|
| Salmon side — $22/kg at 62% yield | 180 g | $6.39 |
| Olive oil — $38 per 5 L | 15 ml | $0.11 |
| Butter — $42.50 per 5 kg | 20 g | $0.17 |
| Plate cost | $6.67 | |
| Menu price $28.00 → food cost | 23.8% | |
| Gross profit per plate | $21.33 |
Every figure above is calculated by the spreadsheet, not typed in.
Next: which dishes actually earn their place
Accurate plate costs are the input. Menu engineering is what you do with them — sorting every dish by popularity and contribution margin into Stars, Plowhorses, Puzzles and Dogs, each with a different action.
There’s a separate free sheet for it, and it uses the proper 70% popularity threshold rather than the “above average” shortcut that quietly mislabels good dishes: the free menu engineering template →
Baking at home rather than running a kitchen?
The same maths, aimed at a different problem: what to charge for a cake when your own time is the biggest cost. The free cake pricing calculator →
Then watch the number that decides everything
Plate costs tell you about a dish. Prime cost — food plus labour as a share of sales — tells you about the business, and it is the figure most operators track weekly. There’s a free tracker for it, built around true COGS rather than purchases alone: the weekly prime cost tracker →
How to use it in Google Sheets
Download the file, then in Google Sheets choose File → Import → Upload. Formulas, drop-downs and conditional formatting all carry across.
Common questions
What food cost % should I aim for?
Full-service restaurants commonly target 28–35%, but it varies enormously by concept — pizza runs far lower, steak and seafood far higher. Set your target in the sheet; it flags against that, not an average.
Where do I get yield percentages?
Weigh it. Buy the item, weigh what you actually plate, divide. It takes one service to do and it’s the single most valuable number in this whole spreadsheet.
Can I use it for catering or a food truck?
Yes — nothing in it assumes a restaurant. Any operation that turns purchased ingredients into priced portions works the same way.
Is anything I type sent anywhere?
No. It’s a file on your computer. This site has no trackers, no analytics and no cookies.
If you’d rather not do this for forty dishes
Everything on this page is free and stays free — the calculator, the spreadsheets, all of it. But costing a whole menu properly is roughly a day’s work, and most kitchens never find the day.
The Menu Profitability Teardown is that work done for you: every dish costed at true yield rather than invoice price, contribution margin in dollars per dish rather than food cost percentage alone, a Kasavana–Smith classification using the proper 70% popularity rule, and a specific list of what to reprice, what to re-engineer and what to cut. You also get the spreadsheet it was built in, so you can rerun it yourself next season. What the teardown covers →
It is a paid service, and the free tools above are not a trial of it — they stay exactly as they are whether or not you ever get in touch.